I won first place at the Hack PSU hackathon in Spring of 2022!
My team’s entry was titled Sauron, which is an event data aggregator and dashboard for crisis situations hosted on Google Cloud Platform.
Our team won first place overall, as well as the first place prize for the Nittany AI category of the hackathon.
Link to demo video 1: Sauron Demo Video 1 on YouTube
Link to demo video 2: Sauron Demo Video 2 on YouTube
Link to our DevPost submission: Sauron on DevPost
Overview of Sauron
Sauron is a proof-of-concept, cloud based, event data aggregator and dashboard for crisis situations. It is meant to collect event reports from multiple data sources and display them in a unified interface for users to interact with. Inside, it is powered by a MySQL database, Flask, youtube-dl, OpenCV, and Grafana.
For the HackPSU hackathon, we only had around 12 hours to build everything.
Our proof of concept demonstrated the following features:
- Unified dashboard interface with event reports plotted on a map
- Automated event report creation from live stream video
- Manual event report creation from users on mobile devices
Google Cloud Platform
Using free credits from GCP, I set up a managed MySQL server, as well as two e2-small VM instances.
One VM instance hosted the Grafana Dashboard, and the other hosted the Flask Web App.
Could we have used Kubernetes or some sort of serverless architecture?
Sure, but we only had about 12 hours to build all of this, so I stuck with what was quick and understandable.
We got a domain name hack-sauron.mooo.com through Afraid DNS, which offers free DNS subdomains. It’s a fantastic service and part of why I love the internet.
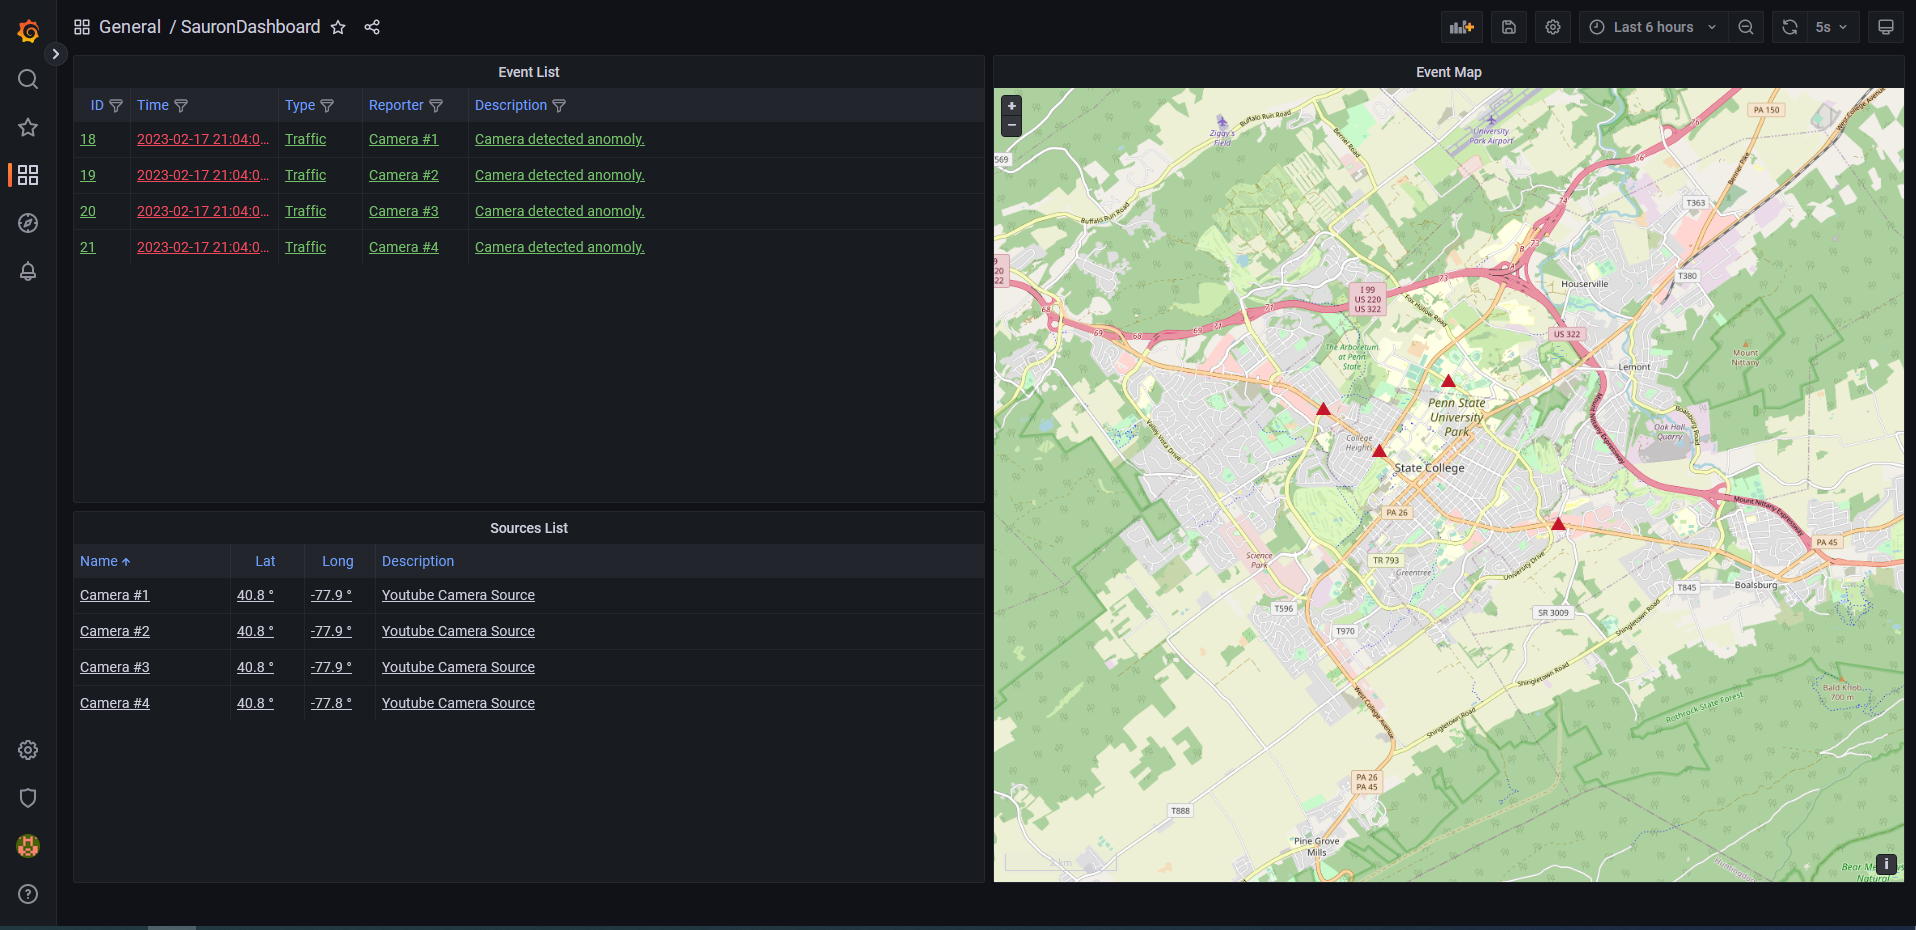
Grafana Dashboard
Our Dashboard was truly the selling point of our entry.
Using Grafana, we were able to create a slick UI within in a few hours, and with zero previous experience.

We used two Table panels to display event reports and event sources.
Event reports were also plotted onto a Geomap panel on the right side.
Grafana’s “Data Links” feature allowed us to make the reports and sources tables linked to the report images and source videos. These images were served by our Flask web-app, and the source videos were simply links to YouTube live-streams of traffic cameras.
One of the cool features of Grafana is using “low code” to grab data from multiple types of sources.
Once the MySQL database connection was up, it was very easy to make some SELECT queries (shown below) to populate the data into our dashboard.
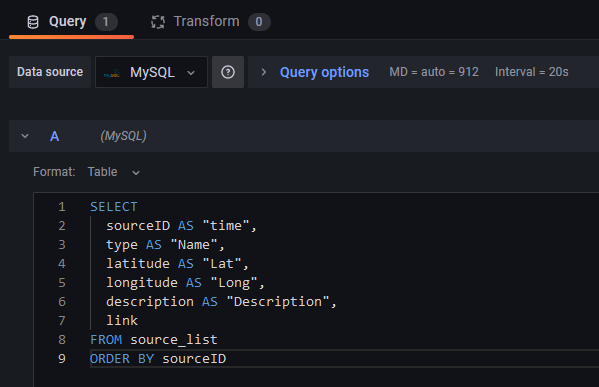
SQL query used to populate the sources list.
Automated Report Submission
Any data aggregator needs to be able to comb through many data sources and pick out events and metrics that actually mean something to the end user.
We used youtube-dl to stream video from live streams on YouTube of traffic cameras. The video streams were then piped into OpenCV to capture individiual frames. We envisioned adding an “anomaly detector” to Sauron to detect car crashes and other “anomalies”, but for the hackathon, we randomly picked video frames and marked them as anomalies.
This Python script would randomly choose frames from the camera live stream, save it to the Flask web-app’s image directory, and make INSERT statements into the SQL database.
Then, Grafana would work its polling magic our randomly generated event reports would be display on the Dashboard.
Manual Report Submission
As mentioned earlier, Sauron provides users the ability to upload event reports from their own mobile devices. Because Sauron is hosted in the cloud, mobile users could use their web browser to open up the form show below to submit event reports.
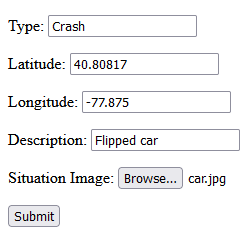
This entry form was a very simple HTML form that POST’s to our Flask web-app’s API.
The Flask web-app saves the user reported photo, and performs an SQL INSERT into the report_list table.
The latitude and longitude of the user’s location is auto-populated using JavaScript in the HTML page. Fun fact, most mobile web browsers block websites from requesting location information unless the website has an HTTPS certificate. Creating a self-signed certificate for the Flask web-app fixed this for us.
Conclusion
The HackPSU hackathon was enjoyable, and exhausting. I did not get a minute of sleep the entire 12 hours. Working with four friends on my team was also enjoyable, and it helped build my skill-set for collaboration and delegating tasks.
For example, I did the initial setup of GCP, SQL database, Grafana, and the HTTPS certificates for Flask. Other team members created the mobile event reporting form, domain name registration, frame capture from YouTube DL, and writing up our submission for HackPSU’s DevPost.
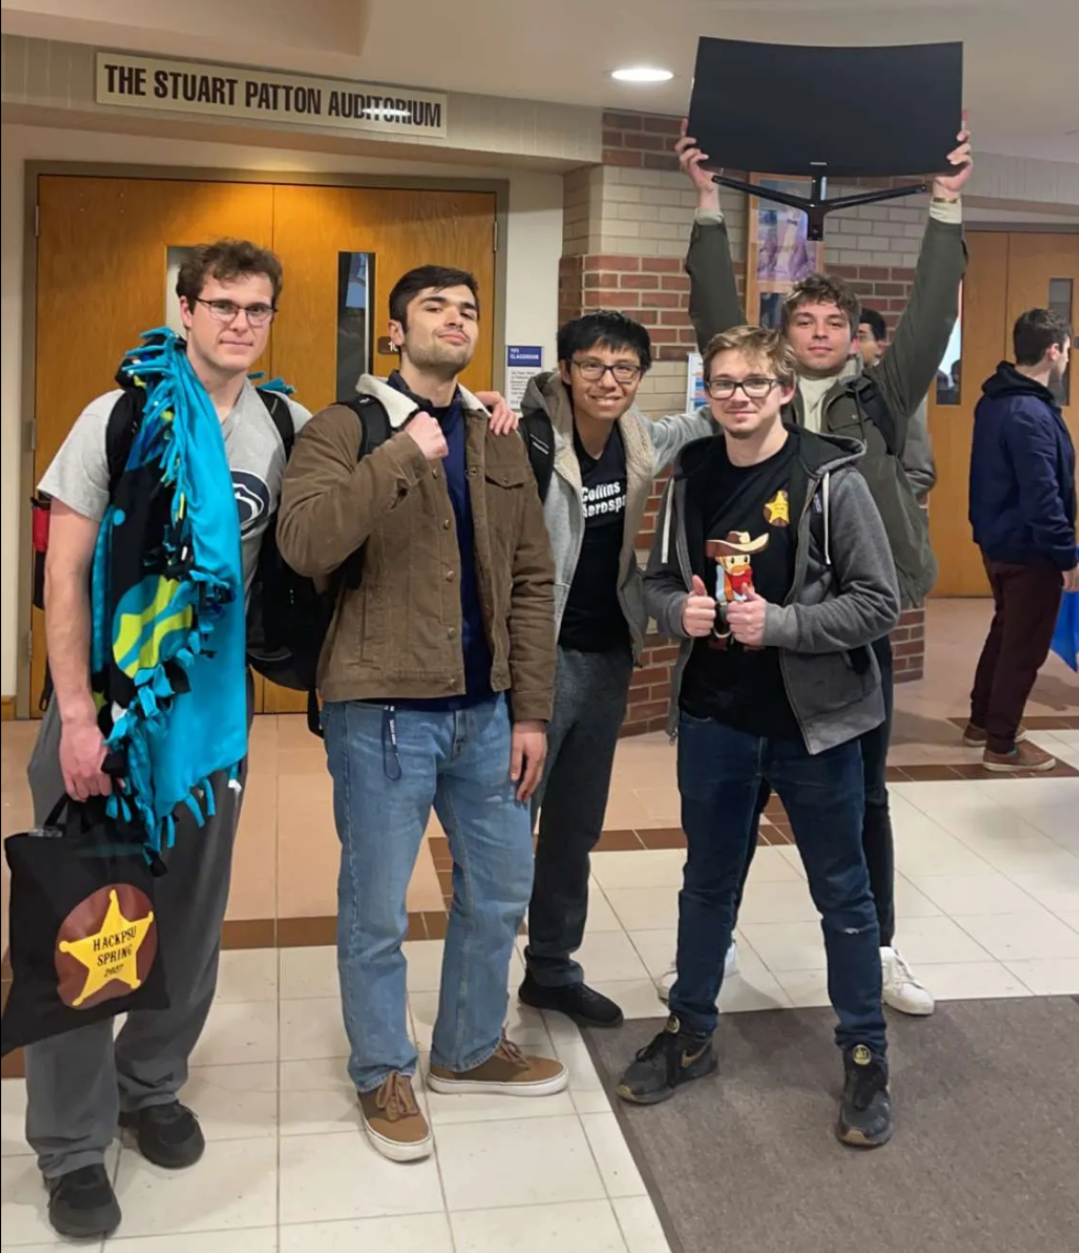
My team and I after the hackathon.
From left to right: Tyler, Ralph, Normen, Jared, Michael